Your odds in NYC's housing lottery: about 1 in 510 per application, and far better with community preference
A City Reporter analysis of 10.25 million applications found the low-income band had the worst odds, while local applicants had about a 1 in 53 shot. Four lotteries close today.
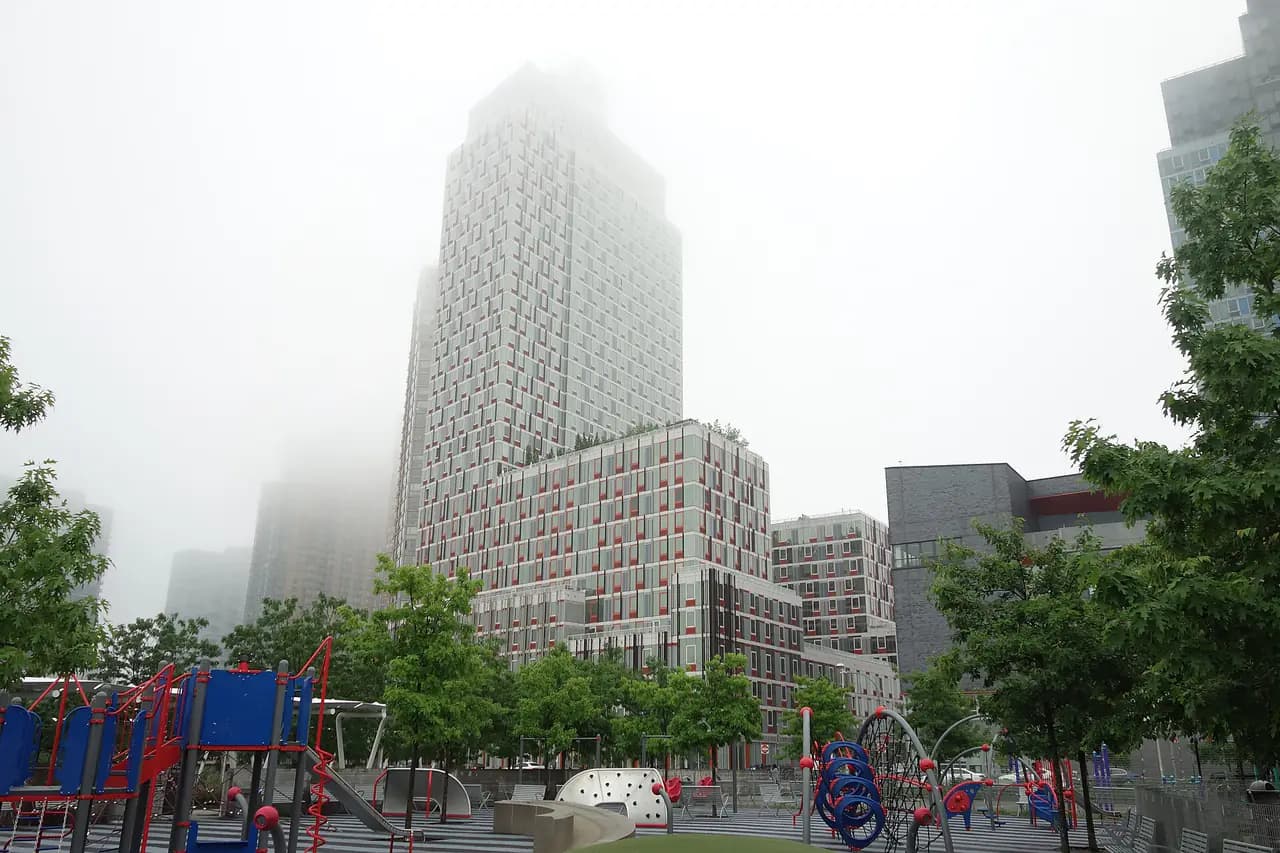
Photo: Tdorante10 / Wikimedia Commons · CC BY-SA 4.0
- A City Reporter analysis found about a 1 in 510 chance per housing lottery application: 10,250,872 applications and 20,200 leases (Jan. 2022–Oct. 2024).
- The 'low income' band had the worst odds (about 1 in 639); moderate and middle-income bands had about 1 in 325 and 1 in 398.
- Community preference changed everything: about 1 in 53 for local applicants vs. about 1 in 1,051 without it. NYCHA residents: about 1 in 182.
- Most leases still went to households earning under about $90,000, but only 4% of 56,271 advertised units since 2020 were for extremely low incomes.
- Four lotteries close today, Nov. 16, and 1 Gouverneur Lane (162 apartments) closes Tuesday, per the city's Housing Connect data.
Any single application to New York City's affordable housing lottery has had roughly a 1 in 510 chance of ending in a lease, according to a new analysis by The City Reporter. Over the two-year span it studied, the city received 10,250,872 applications, and 20,200 households signed leases for rent-stabilized lottery apartments.
The odds per person are better than that, because many people apply to more than one lottery, NYU Furman Center executive director Brad Greenburg told the outlet. The newsroom used lottery data that the Department of Housing Preservation and Development submits to the City Council by law, covering January 2022 to October 2024, and explains its math in a separate methodology note.
The odds at a glance
- Overall: about 1 in 510 per application.
- By income band: the "low income" band, roughly $78,000 to $124,240 for a family of four at the time, had the worst odds, about 1 in 639. The "moderate" and "middle" bands did better, about 1 in 325 and 1 in 398.
- Community preference: applicants who live in the community district where the building is had odds of about 1 in 53, versus about 1 in 1,051 without that preference.
- NYCHA residents: about 1 in 182 (44,702 applied; no more than 255 signed leases). City employees: about 1 in 564.
- By race: odds ranged from about 1 in 444 for Pacific Islander applicants to about 1 in 591 for Hispanic applicants, the analysis found.
Who actually got the apartments
Even with longer odds, most leases went to lower-income households, The City Reporter found. About 30% of the 20,200 leases, just under 6,000, went to "extremely low income" households, roughly a third to "very low income" households and nearly 24%, or 4,735, to "low income" households. That means most lottery leases went to New Yorkers earning less than about $90,000.
The supply skews the other way. Of 56,271 apartments advertised on Housing Connect from July 2020 to Nov. 2, 2026, just 4% were set aside for extremely low-income households, while 39% were for middle-income households, according to the analysis. About 2,698 winners turned down an apartment, most of them in the low-income band.
Where the apartments are
Community districts covering Long Island City, Williamsburg and Greenpoint, Downtown Brooklyn, East New York and the South Bronx had the most lottery apartments since 2020. Staten Island's Mid-Island and South Shore, Laurelton–Rosedale–Queens Village, Bay Ridge, and Howard Beach–South Ozone Park had the fewest, The City Reporter reported.
If you're applying
- The drawing is random. Leasing agents interviewed for the analysis stressed there is no way to pay or know someone to get ahead; preferences such as community, disability and NYCHA status are built into the drawing.
- Check your income band first. Each listing sets income limits by household size, based on area median income; HPD explains the bands on its AMI page. Applying only where you qualify saves you a long verification process.
- Apply only through Housing Connect. Applications are free on the city's official portal. Our Housing Connect guide walks through the steps.
- Deadlines today: applications close Monday, Nov. 16, for 1529 Brooklyn Ave., 292 E. 51st St. and 315 E. 29th St. in Brooklyn and Artifact No. 1861 Phase II in Manhattan, according to the city's Housing Connect open data; 1 Gouverneur Lane, with 162 apartments, closes Tuesday. See all lotteries closing this week.


- The City ReporterWhat Are Your Odds of Winning New York's Affordable Housing Lottery?
- The City ReporterHow Our Newsroom Estimated NYC Housing Lottery Odds
- NYC Department of Housing Preservation and DevelopmentFind Affordable Housing
- NYC Department of Housing Preservation and DevelopmentArea Median Income
- NYC Open Data (HPD)Advertised Lotteries on Housing Connect
Every story links to the reporting and records it’s based on. Our editors write each piece from public reporting and official data, and check it against those sources before it’s published.
Comments
0NSynced with CommunityIn CommunityYour comment is also posted to Community with this story attached, so neighbors can find it and reply there too.
No comments yet
Start the conversation — your comment shows up here and in Community for neighbors nearby.